We value your privacy
This website uses cookies to ensure you get the best experience on our website.
 Skip to main content
This website uses cookies to ensure you get the best experience on our website.


Most websites are too cluttered and fail to efficiently guide users to the content they’re looking for. But making changes to your company’s website can be a serious headache. Every stakeholder has an opinion, and getting anything done can be a major challenge. If you work for a digital agency dealing with client websites, this likely rings especially true.
It’s one of the reasons our team at EyeQuant has put so much effort into building technology for objective design analysis. The vision? Something like spell check, but for web design. In this post, we’ll give you the playbook for how to use EyeQuant to advocate for design changes (with objective data), so you can make a powerful statement about what needs to be done.
If you haven’t heard of EyeQuant, here’s the idea: we take lots of user research data, and use machine learning to analyse how different design characteristics impact the way people see and perceive websites. The result is a set of predictive algorithms that instantly analyse the design to show which content users are likely to see and miss, and rates the visual clarity and emotional impact of the design.
If you follow this playbook, you’ll be able to walk into any design discussion with objective analysis and decision criteria. Let’s go!
As an example, I’ve used the product detail page (PDP) for Frette, my favorite luxury linens brand. However, this approach has worked for all kinds of different pages, on all different kinds of websites. If you work for an agency, this is a killer approach to pitching for redesign, UX, and CRO work.
If you can gain some consensus on this point, the rest of the process gets dramatically easier. A good question to ask is which 3-5 pieces of information are most critical to the user experience? We recommend the 3 Ws Framework.
The 3 W’s Framework is simple: identify the content in the design that describes what the page is about (some statement of relevance), why users should care (a value proposition), and where they should go next (a call to action of some kind). Mark them up on the page for your team (or client) to see.
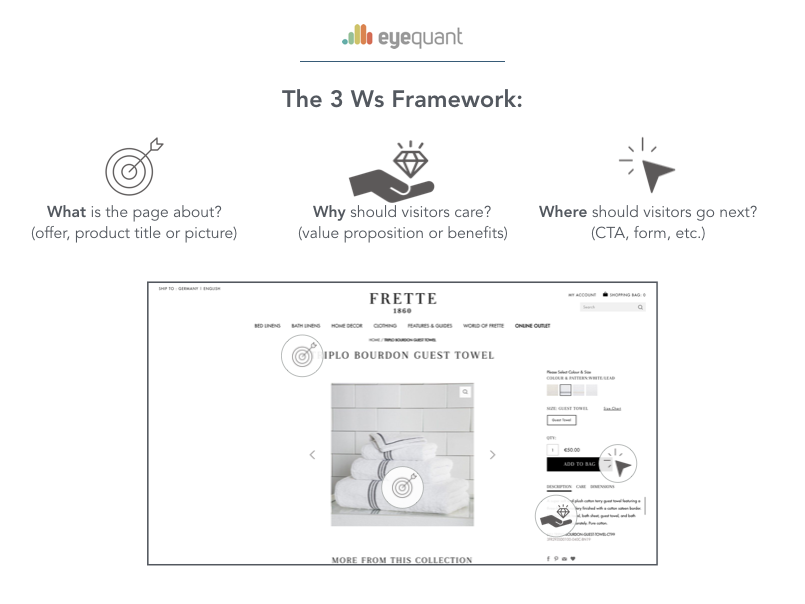
Here, I’ve identified the product title and picture as describing what the page is about , while the product description explains why I should buy it, and the CTA button indicating where I should go next.
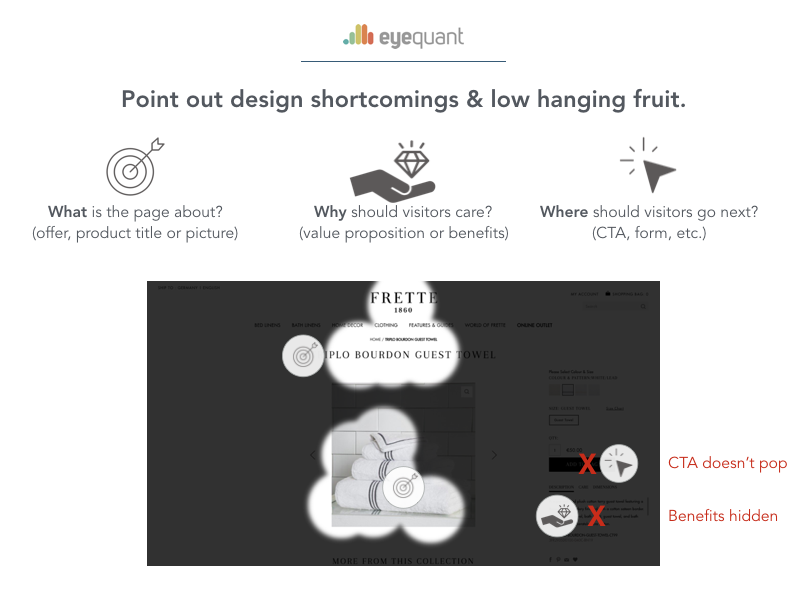
You’ve already identified the most important content on the page, so now we can simply test whether or not the design is doing an effective job of guiding users’ eyes to that content. Most of the time, you’ll find some obvious improvement potential.
I recommend using the Perception Map for this, which very clearly points out the content that people are likely to see (and miss) during the first 3 seconds (roughly 10 eye movements) after landing on the page. The idea here is simple: if it takes more than 10 eye-movements to find the most important content, the design is failing.
This analysis should only take a couple of minutes if you have access to EyeQuant. If you don’t have a subscription yet, get in touch with us or sign up for a free trial (limited time only).
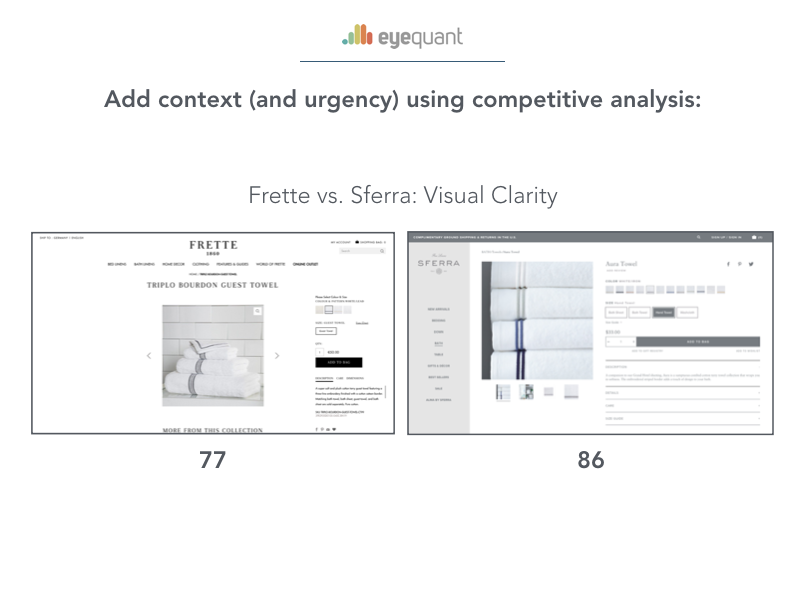
I like to use the Visual Clarity score for this, which rates the design from 0-100. Low scores mean it’s too cluttered, and high scores mean the design is clean and clear. For Frette, I chose to compare their PDP with that of Sferra, one of their top competitors. While Frette’s 77 is a reasonably good score for this kind of page, it objectively falls short of the 86 that Sferra achieves with their own PDP.
We just saw that Frette’s Visual Clarity score is lower than Sferra’s, but why does that matter? When using the Visual Clarity score as a basis for comparison, I always like to follow it up with this graph, which shows how sites with higher clarity scores tend to earn higher engagement from users (and in particular, lower bounce rates). Some data like this should help ensure that your competitive benchmarking has the maximum impact.
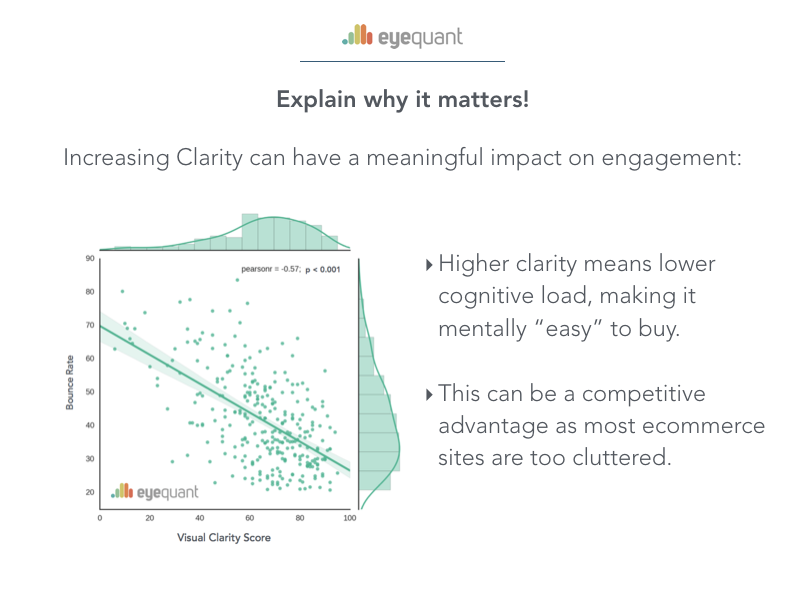
Note: this graph is from an EyeQuant study (full summary here) that was featured in Inc. Magazine and Co. Design.
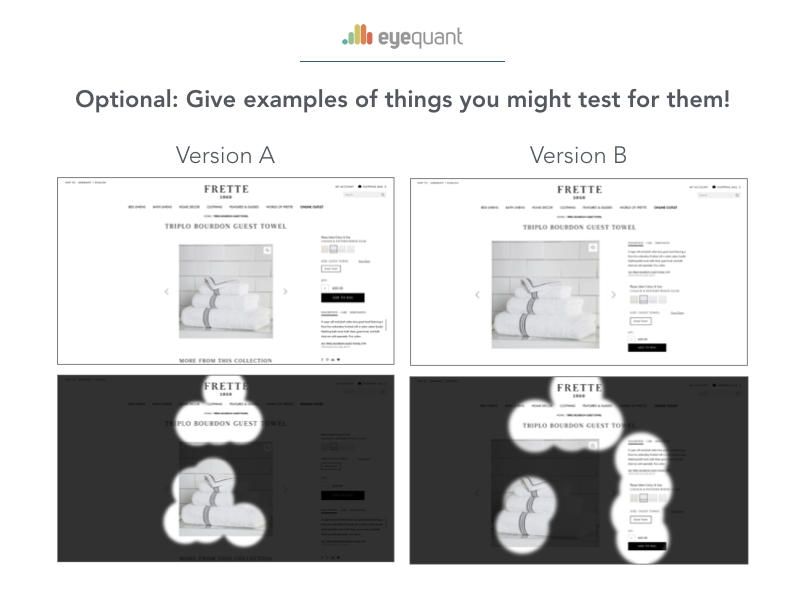
This might sound overwhelming, but even the most basic mockup will do. In a pinch, I’ll often edit webpages in Chrome’s Developer Tools, or even in Keynote or PowerPoint to make simple changes to a design. With EyeQuant, you can instantly analyze the mockups and show how it might effect the user experience.
For Frette, I simply moved the CTA button and product description to try and improve eye-flow and ensure users will see the 3 Ws right away.
After this kind of analysis, even the most difficult stakeholders should be excited about improving on the design. For agencies, this is the moment in a pitch where the client leans forward and suddenly has lots of questions, sparking the kind of specific, actionable discussion that they’re not having with other agencies.
I hope this playbook will help you. If it does, I’d love to hear your story and share it on the blog! You can get in touch with us here, or leave a comment below!