We value your privacy
This website uses cookies to ensure you get the best experience on our website.
 Skip to main content
This website uses cookies to ensure you get the best experience on our website.


Our AI-powered eye-tracking technology provides instant, actionable insights to empower your design team. In this article, we give an overview of the EyeQuant results and how to use them to make and validate design changes.
One of the primary goals of using EyeQuant is to understand how users perceive and interact with your design. EyeQuant provides several key insights that can help you improve your design’s effectiveness”
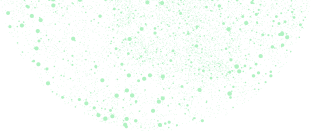
Perception Maps are a fundamental component of EyeQuant’s analysis. They reveal what users see in the first three seconds of landing on a webpage.
This information is invaluable because it aligns with the limited attention span of online users. By highlighting the key visual elements that users notice first, designers can ensure that critical information is presented prominently.
Perception Maps enable the iterative process by showing designers what aspects of their designs are effectively capturing user attention and what might need adjustment.
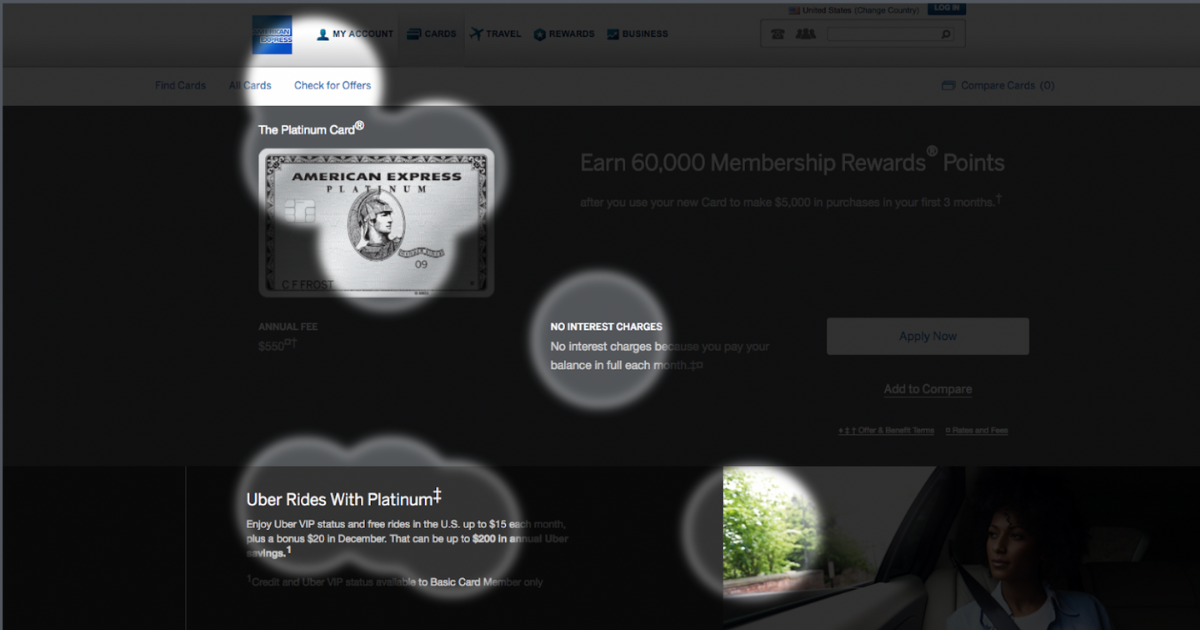
Attention Maps offer insights into how user attention is distributed across different areas of a design. This tool allows designers to see where users focus the most and the least.
This information is instrumental in optimising the placement of important elements, such as calls to action (CTAs) and key information. By identifying areas of high and low attention, designers can refine their designs to guide users toward the most relevant content and actions.
Understanding this can help you align user attention with your design goals.
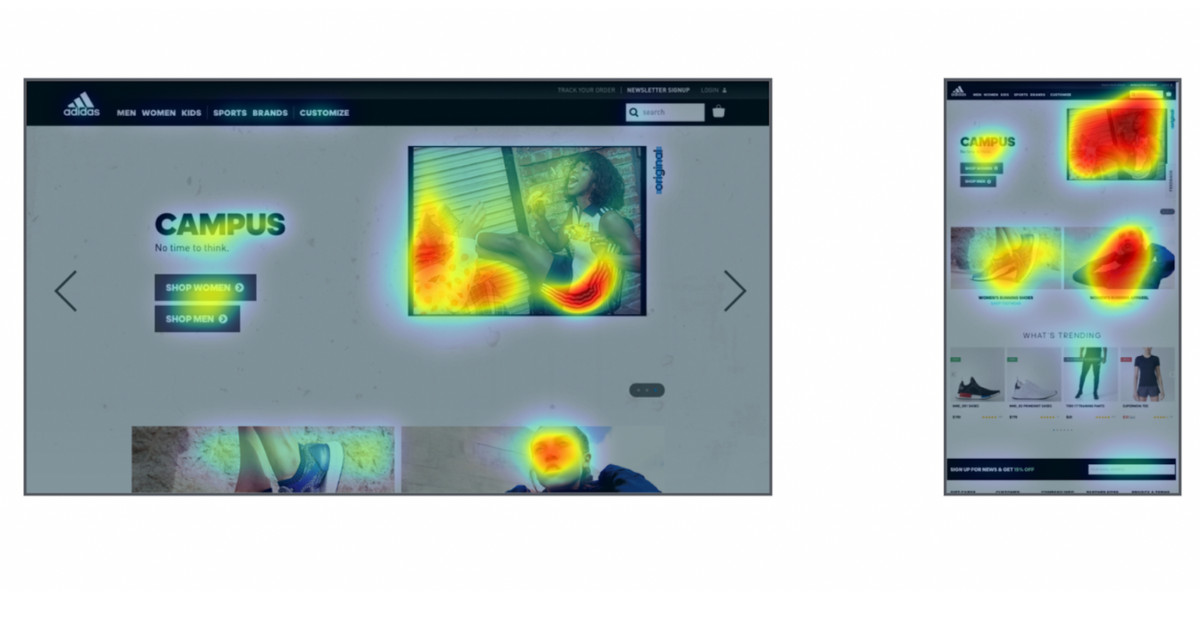
Hot Spots identify the top 10 most eye-catching spots on your design. Each magenta circle represents a focal point, and larger circles indicate higher visibility.
This information can help you optimise the placement of critical elements to capture user attention effectively.
Regions of Interest quantify the visibility of specific design elements or areas. Designers can measure how eye-catching certain regions are compared to the overall design visibility.
For example, it can show that the main Call-to-Action (CTA) is 225% more visible than the average pixel.
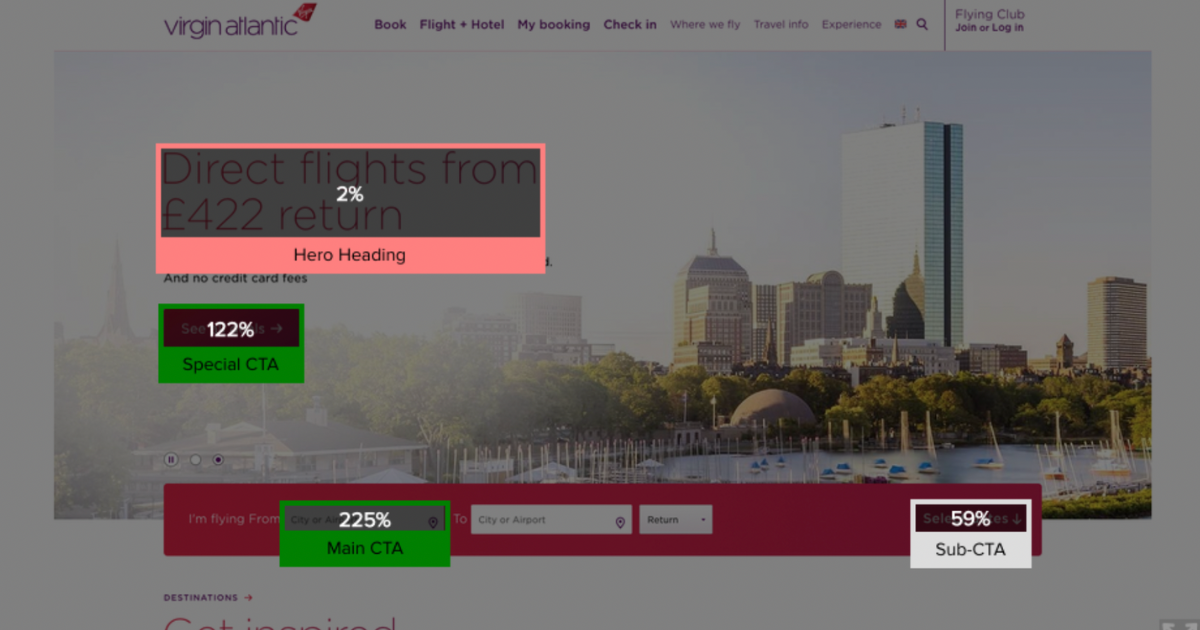
This tool is particularly useful for evaluating the effectiveness of specific design changes, and understanding which elements stand out and which ones need improvement.
The Clarity Map assesses how clear and clutter-free your design is. Cleaner designs make it easier for users to find what they’re looking for. It quantifies the cognitive load imposed on users by design clutter.
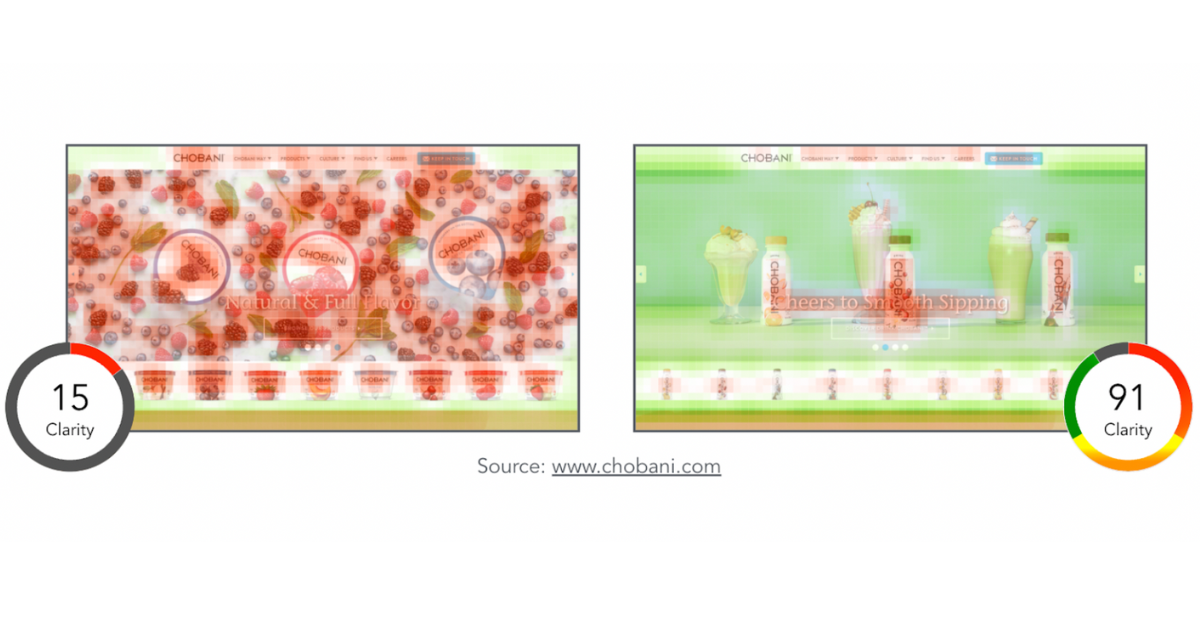
By using Clarity Maps, designers can make informed decisions about simplifying their designs and ensuring that critical information stands out clearly.
EyeQuant assigns scores for clarity and excitingness to your design. A higher clarity score indicates a cleaner and clearer design, while excitingness measures the design’s stimulation level.
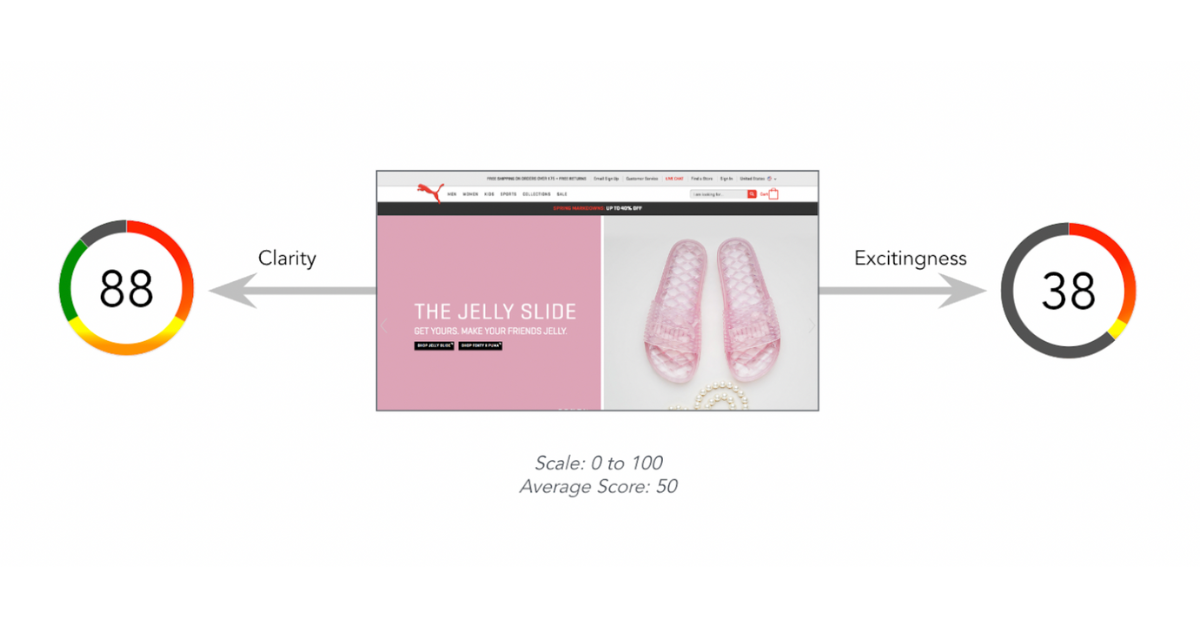
These scores provide a quick overview of your design’s strengths and areas that may need improvement.
EyeQuant results help to understand how users perceive a design, and facilitate making data-driven improvements. Incorporating EyeQuant into your design process can lead to more user-friendly and effective interfaces.
See how EyeQuant can help you create higher converting digital experiences with our 7-day free trial.

Most digital optimisation happens after launch. After the traffic. After the budget is spent. In this session, Giovanni Pola,...
Read more
Why do users miss what seems obvious? In our latest webinar, Professor Peter König, one of the world’s leading...
Read more
In this session, we explored how teams can move beyond instinct and start making creative decisions based on how...
Read more