We value your privacy
This website uses cookies to ensure you get the best experience on our website.
 Skip to main content
This website uses cookies to ensure you get the best experience on our website.


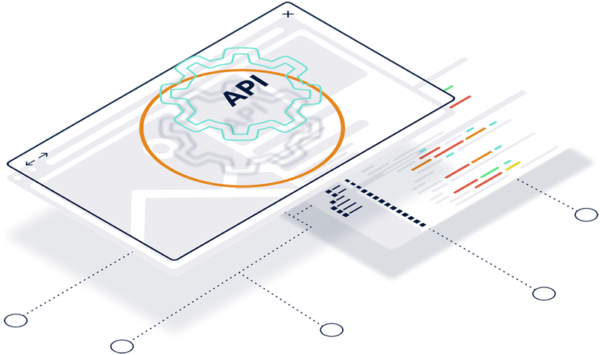
With the EyeQuant RESTful HTTP API, you can have full programmatic access to all of EyeQuant’s predictive algorithms, scores, and eye-tracking visualisations. It means within your solutions and products you can generate visual attention heatmaps, analyze mobile web designs, calculate perception scores, and more. By creating deep integrations into your products, your colleagues and customers can gain instant insights into how users perceive their digital experiences.
The most popular use cases:
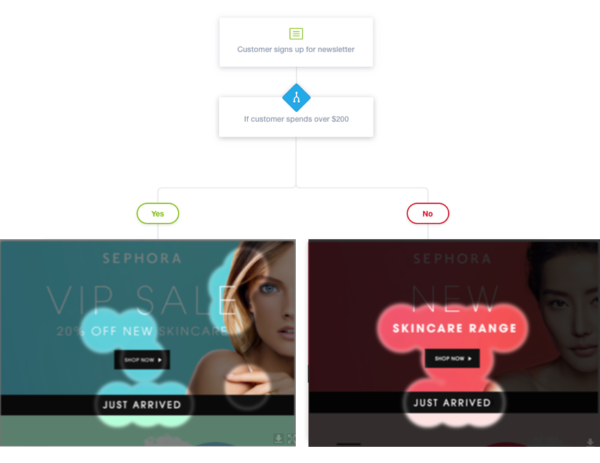
51.1% of users spend less than 2 seconds on an email before deciding to read on or hitting delete. If users don’t instantly see a reason to engage, you’ve lost them. By integrating EyeQuants visualisations into marketing automation platforms like ActiveCampaign, Hubspot or Episerver, via the EyeQuant API marketers can see precisely what recipients will notice first when they open an email or land on a personalised page. This advanced level of analytics means your team can be sure that the most engaging campaigns are being seen.
Imagine being able to see which elements of your prototype will be completely missed by users. Integrating attention analytics into prototyping software like InVision, Adobe Experience Design or Sketch, helps designers to test design hypotheses, validate, iterate and improve products before they enter the development sprint. This means your design and development teams produce better digital products at a much faster rate.
Here’s how to use attention analytics to build even more powerful solutions for your company and customers:
So, where to begin?
The first step we’re going to do is to take a screenshot of a webpage.
Let’s take a screenshot of Google.com:
“`bash
curl \
-X POST \
-H “Authorization: Bearer $apikey“ \
-H “Content-Type: application/json” \
-d ‘{
“input”: {
“type”: “webPageUrl”,
“content”: “http://www.google.com”,
“medium”: “desktopWeb”,
“title”: “Example”
}
}’ \
https://api.eyequant.com/v2/analyses
“`
What’s going on here?
We are making a `HTTP POST` to the `/v2/analyses` resource, authenticated with our `API key` (replace `$apikey` with your credentials). We are specifying that we are sending `JSON` data via the `Content-Type` header. Our **input** for the analysis is a `webPageUrl` and the medium is `desktopWeb`. This is telling the API to take a screenshot of `www.google.com`, then simulate a **desktop web browser**, and to run an analysis on the result. We can also tell the API to simulate a mobile web browser by passing `mobileWeb` as the *medium* parameter instead of `desktopWeb`.
The API’s response to this call looks like this:
“`
HTTP/1.1 201 Created
…
Location: https://api.eyequant.com/v2/analyses/611457618c1d4283a830d10a9ad4f8ae
{
“location”: “https://api.eyequant.com/v2/analyses/611457618c1d4283a830d10a9ad4f8ae”,
“id”: “611457618c1d4283a830d10a9ad4f8ae”
}
“`
This informs us that the analysis has been `accepted`, a resource has been created to represent it, and that we can find it in the specified `location`. We can follow the link to this resource and find out more about the analysis:
“`
curl \
-H “Authorization: Bearer $apikey” \
-H “Content-Type: application/json” \
-X GET \
https://api.eyequant.com/v2/analyses/611457618c1d4283a830d10a9ad4f8ae
“`
“`json
{
“id”:“611457618c1d4283a830d10a9ad4f8ae”,
“outputs”:{
“attention”:{
“attentionMap”:“https://eyequant.s3.amazonaws.com/users/…”,
“hotspotsMap”:“https://eyequant.s3.amazonaws.com/users/…”
},
“clarity”:{
“map”:“https://eyequant.s3.amazonaws.com/users/…”,
“score”:82
},
“excitingness”:{
“map”:“https://eyequant.s3.amazonaws.com/users/…”,
“score”:7
},
“input”:{
“image”:“https://eyequant.s3.amazonaws.com/users/…”
}
},
“status”:“success”
}
“`
Woohoo! 🎉
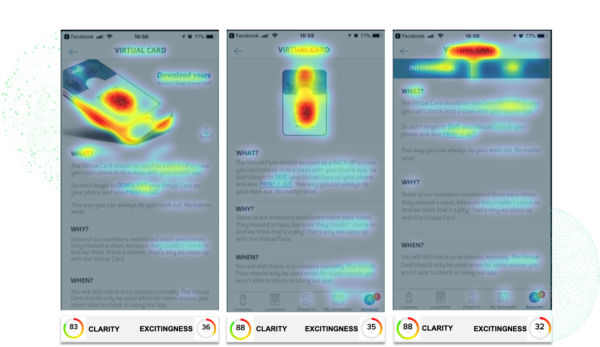
As you cans see, we have here **4** elements: `input`, `clarity`, `excitingness` and `attention`. The input is the screenshot taken in the previous step, but for the rest of the inputs let’s talk a bit more.
The Clarity Score is an instant design metric based on Visual Clarity data. Clarity is the opposite of Clutter. Clutter is the state in which excess items, or their representation or organization, lead to a degradation of performance at some task. Cluttered designs lack visual order, thus increasing cognitive load as users struggle to navigate the visual landscape and understand which parts are important. Studies show that *the higher the Clarity the Lower the Bounce rate*.
The Attention Map gives us a more granular perspective of which content receives the most attention. With this result, you can easily determine if the elements receiving the most attention are in line with your design goals. Warmer (red) areas have the most visibility. Here’s a tip: Think of attention as a finite budget. Make sure you’re spending that budget wisely, and leveraging attention towards the most relevant content and CTA’s.
The Excitingness Score is an instant design metric based on Emotional Impact data. Aesthetics have been recognized as important because of their positive influence on people’s behavior, such as on performance under conditions of poor usability, or on purchase intentions. Even before elaborate considerations about purchases can possibly take place, the first impression of appeal determines how we perceive other attributes of a product, such as its usability and trustworthiness
Find out more about EyeQuant’s API documentation HERE or email marketing@eyequant.com for further information.

Our AI-powered eye-tracking technology provides instant, actionable insights to empower your design team. In this article, we give an...
Read more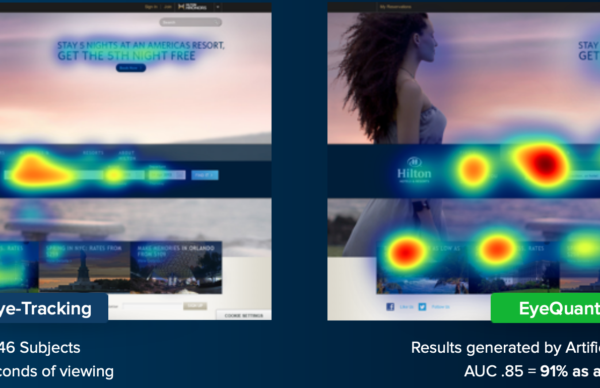
What is predictive eye-tracking data and who should be using it? Put simply, eye tracking is the...
Read more