We value your privacy
This website uses cookies to ensure you get the best experience on our website.
 Skip to main content
This website uses cookies to ensure you get the best experience on our website.


A/B testing is a powerful method for testing design variants, but it’s also expensive. Each test costs time, traffic, and development resources. Adding to the frustration, only one out of seven A/B tests generates any meaningful uplift in the first place. This means there’s always a considerable risk that the test variants will underperform, cost immediate revenue and eat up time and money. Almost all conversion teams feel the strain of limited resources in one way or another.
Ultimately, one of the key drivers of ROI for your testing program is figuring out which ideas are actually promising enough to test. This is an especially tricky task when it comes to design tweaks since it’s often dependent upon subjective opinions. In this case study, you’ll see how Monito leveraged A.I. to pre-screen their design ideas to settle on the most promising variants for an A/B test in a data-driven way.
Specifically, they were improving a landing page that shows the currency exchange rate in real-time and visitors can sign up to be notified when the exchange rate is better. This was the design:
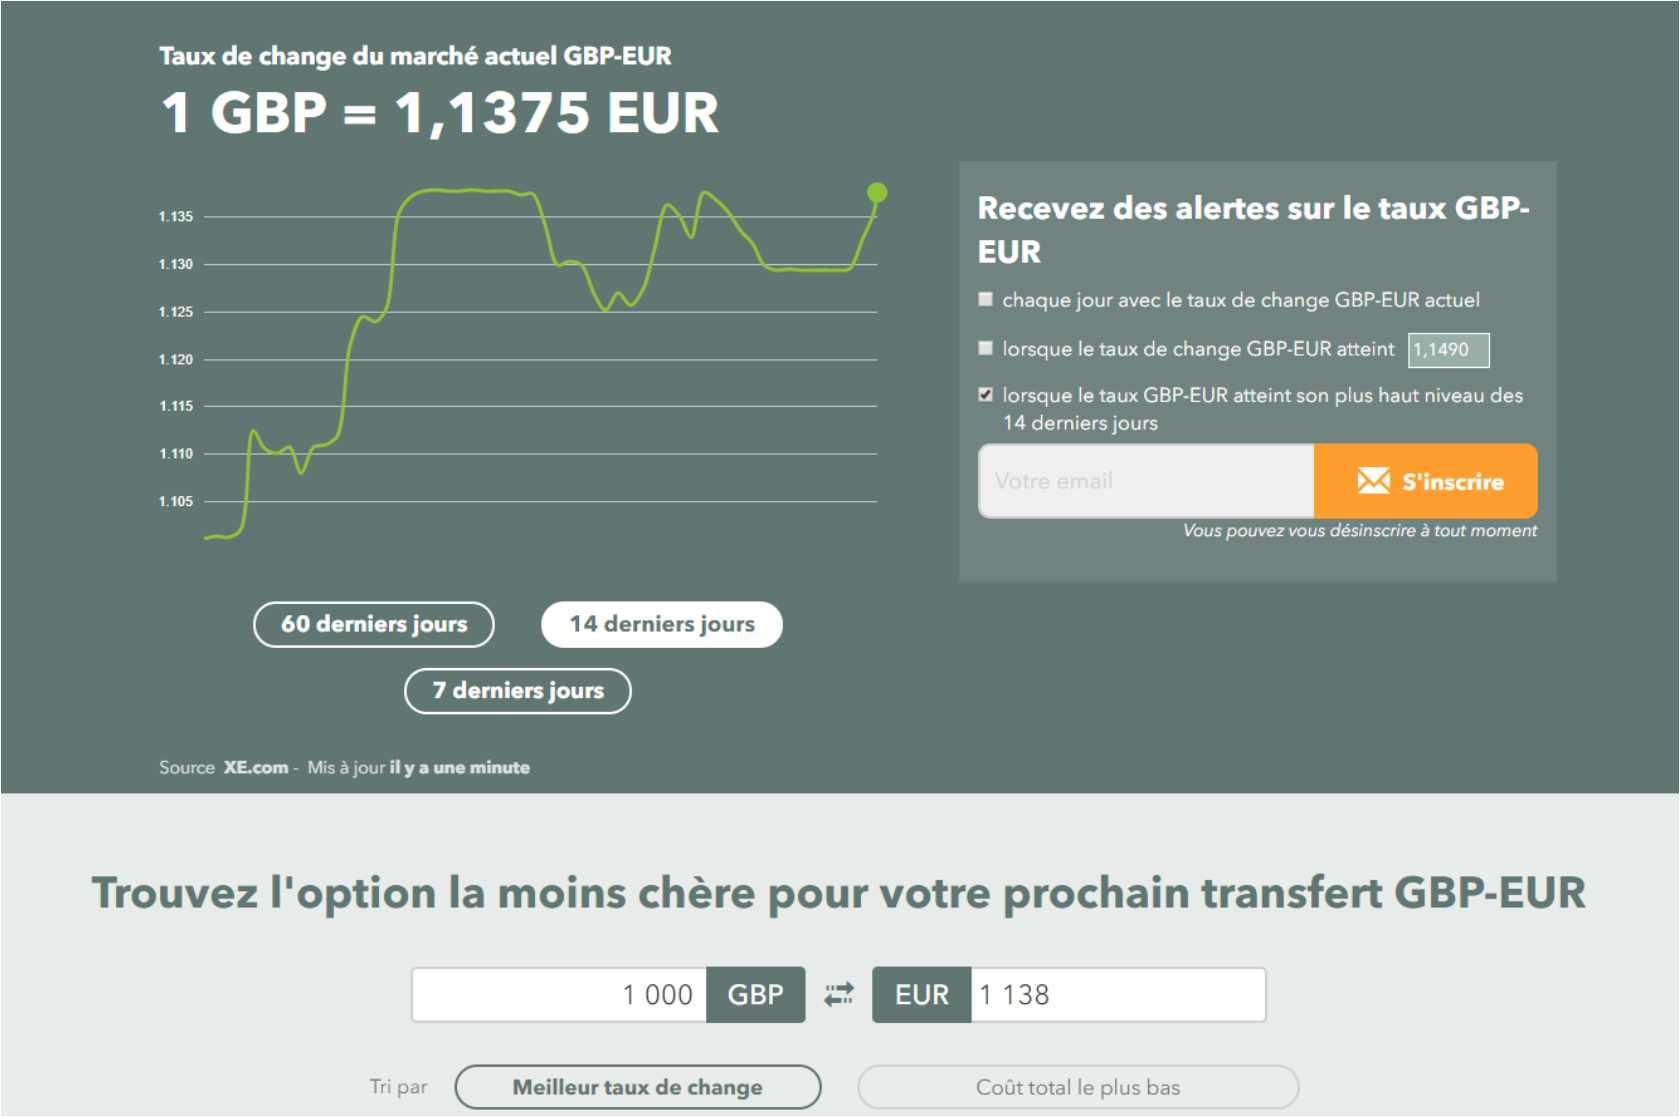
Monito wanted to improve the performance of their leadbox on the right to increase the number of sign-ups. To do so, they looked for a fast and practical method which doesn’t require much traffic. Monito turned to EyeQuant, a technology for predictive design analysis, to test different iterations of this landing page. They hypothesized that making the leadbox more visually apparent will increase conversions. To test how eye-catching it was they used EyeQuant’s visual attention analysis and immediately found potential conversion killers. Here are the results:
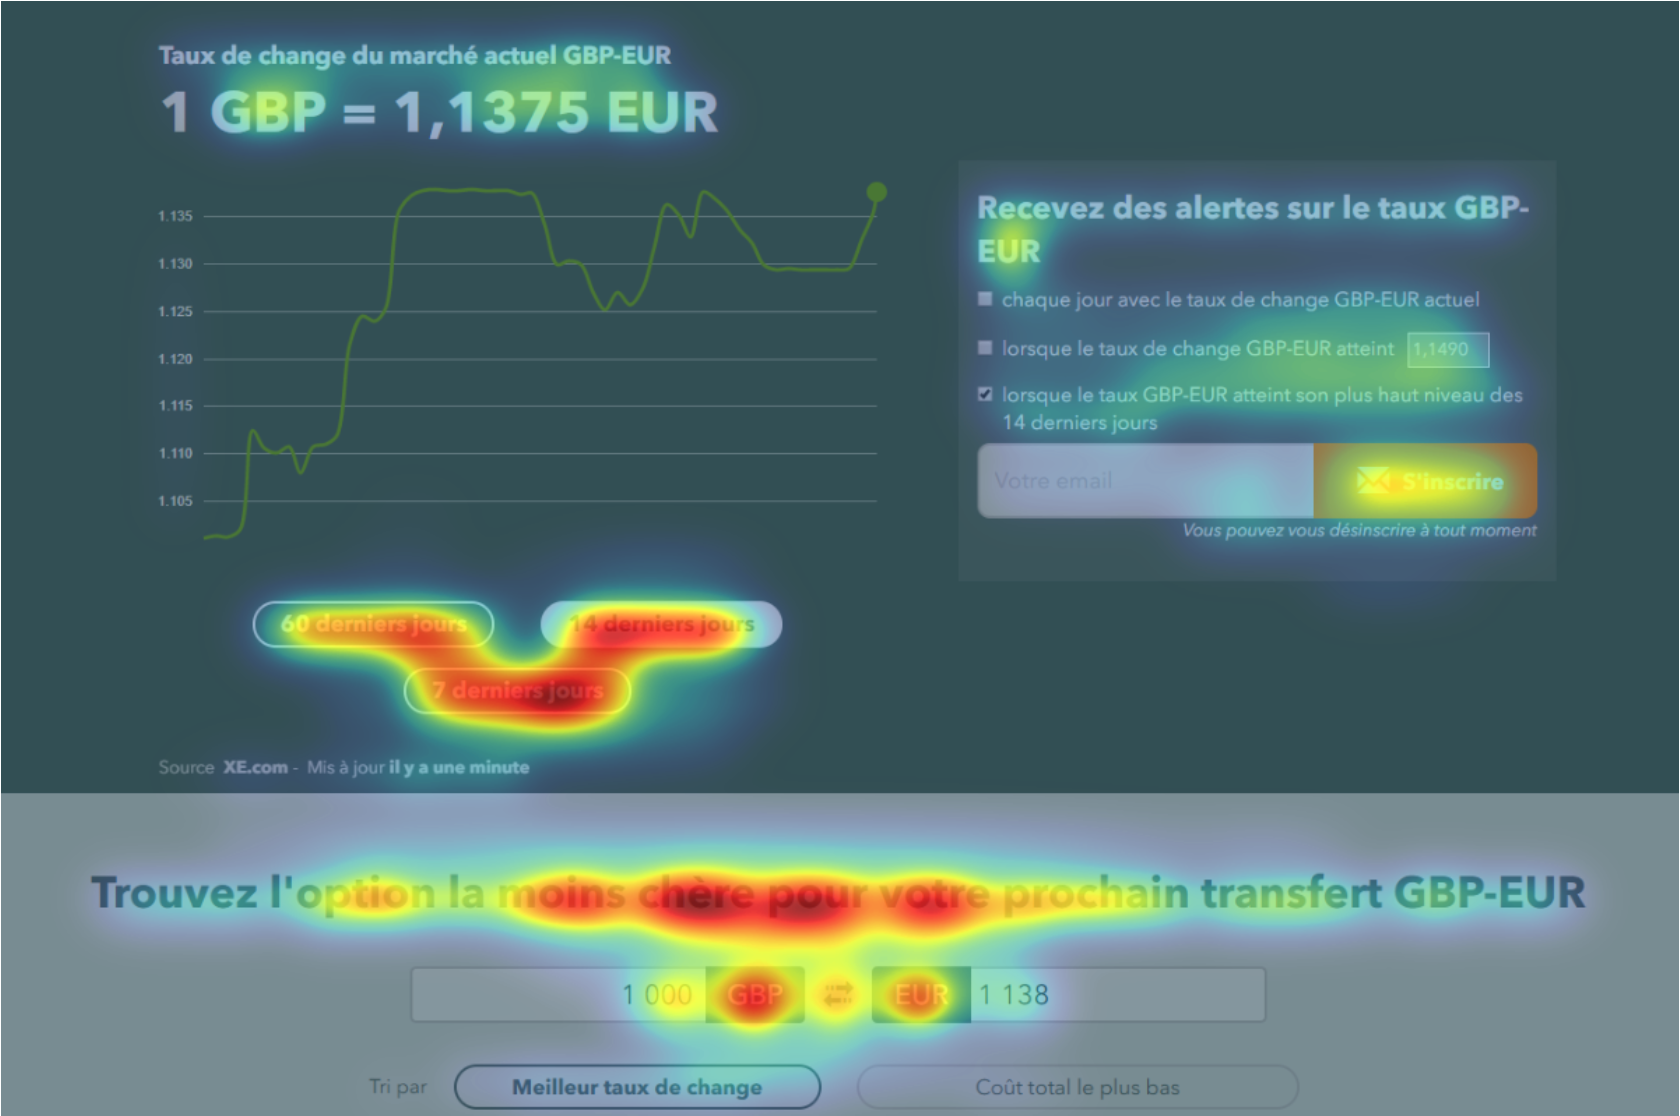 EyeQuant applies machine learning to large amounts of user data to give predictions on future user behavior. Here we see a heatmap of which content will most likely be seen in the first seconds.
One possible reason for the leadbox underperforming was because it barely received any attention. Other more visible elements distracted from the main content. Based on this insight, Monito designed multiple iterations and tested them with EyeQuant to get immediate, objective feedback. In total, Monito tested 12 different designs and rated them based on the visibility of their main conversion element: the lead box.
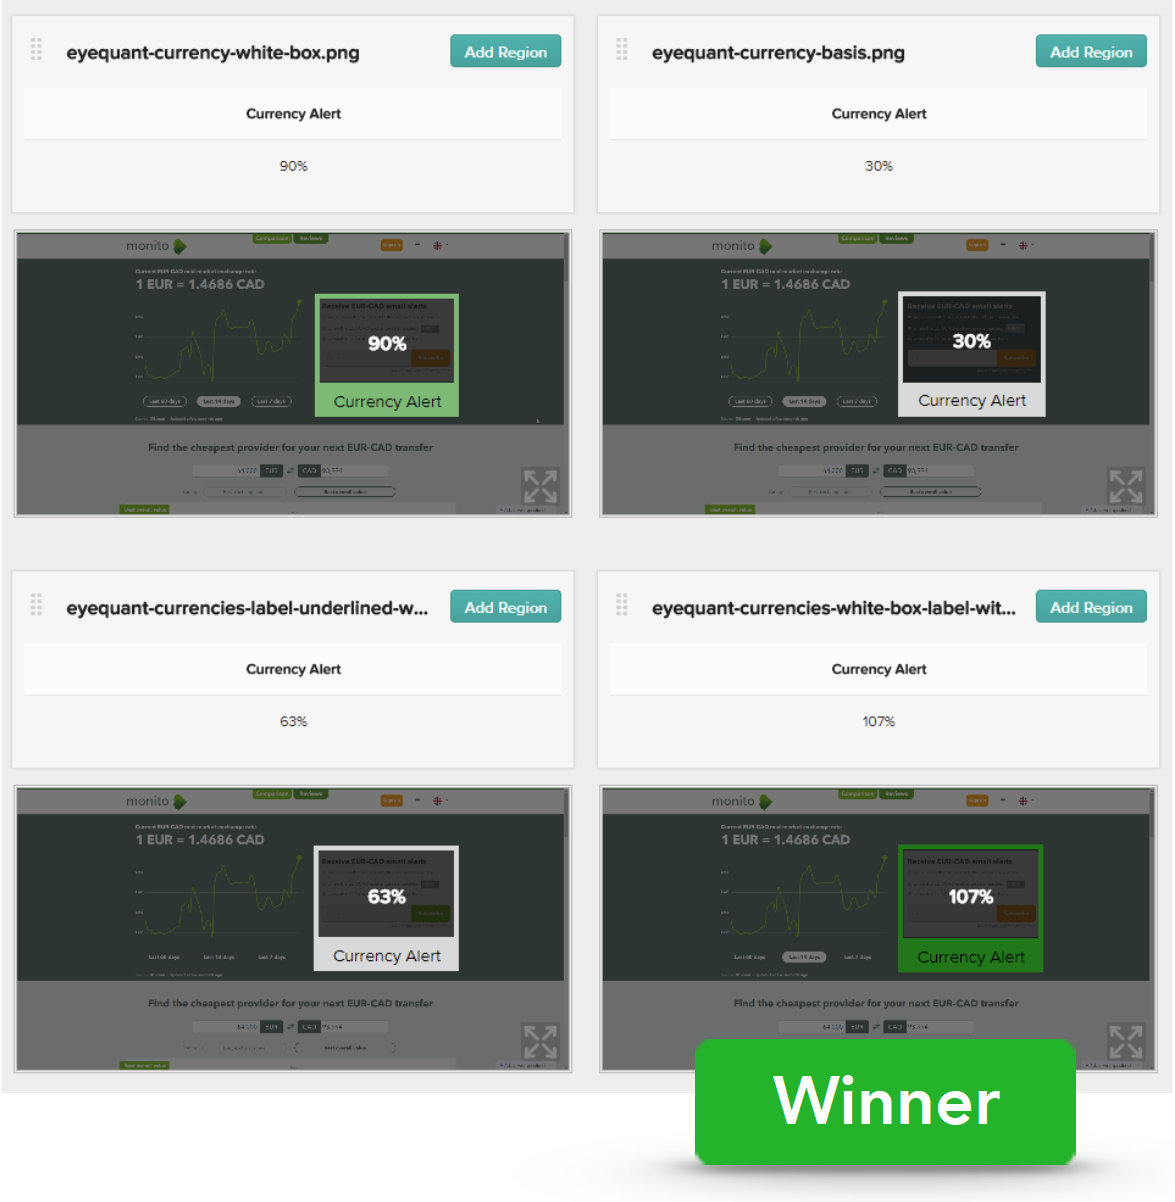 Monito tested which design performed best with regard to the leadbox’s visibility via EyeQuant’s Regions of Interest. They provide detailed data on how visible a part of a design is compared to the average content on the screen (measured in %). This makes comparing different designs easy.
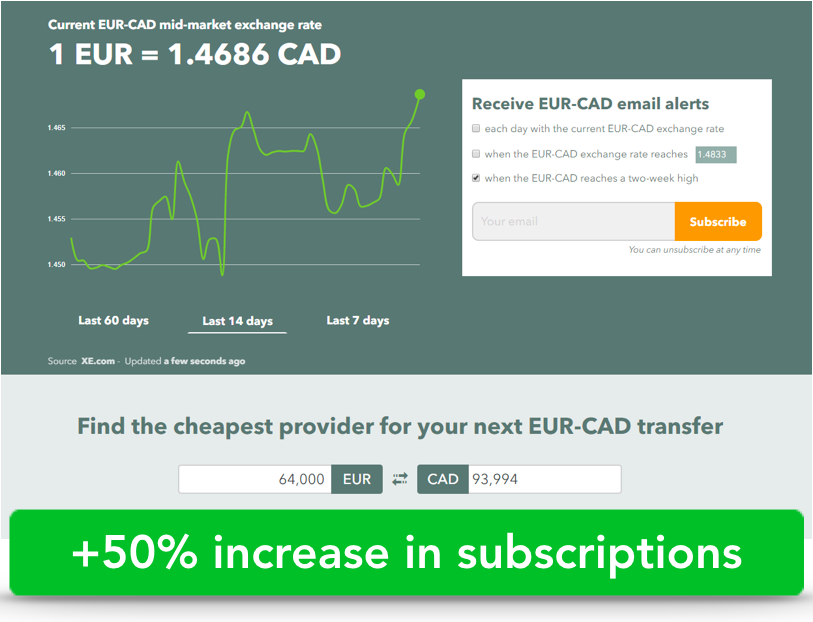
EyeQuant’s ability to measure the visibility of a specific region meant Monito could get “… quick and quantitative feedback on a design and help make faster decisions about which options to develop and test in real conditions.” (Pascal Briod, Co-Founder). As a result, they didn’t have to live-test each variant. This saved lots of traffic and resources that would’ve otherwise been spent on weaker variants.
Testing the 12 different iterations enabled Monito to select the version with the most visible lead box. They then A/B tested the winning design and shortly after saw sign-ups increase by 50%!

Why do users miss what seems obvious? In our latest webinar, Professor Peter König, one of the world’s leading...
Read more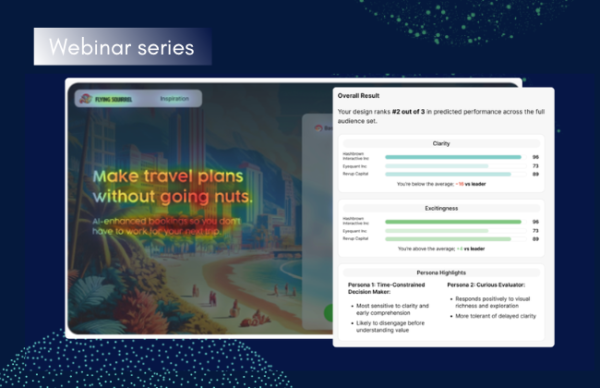
In this session, we explored how teams can move beyond instinct and start making creative decisions based on how...
Read more
What does attention prediction actually look like in day-to-day design work? In this month’s webinar, we’re joined by leading...
Read more